6 MRS
6.1 MRS Metabolites
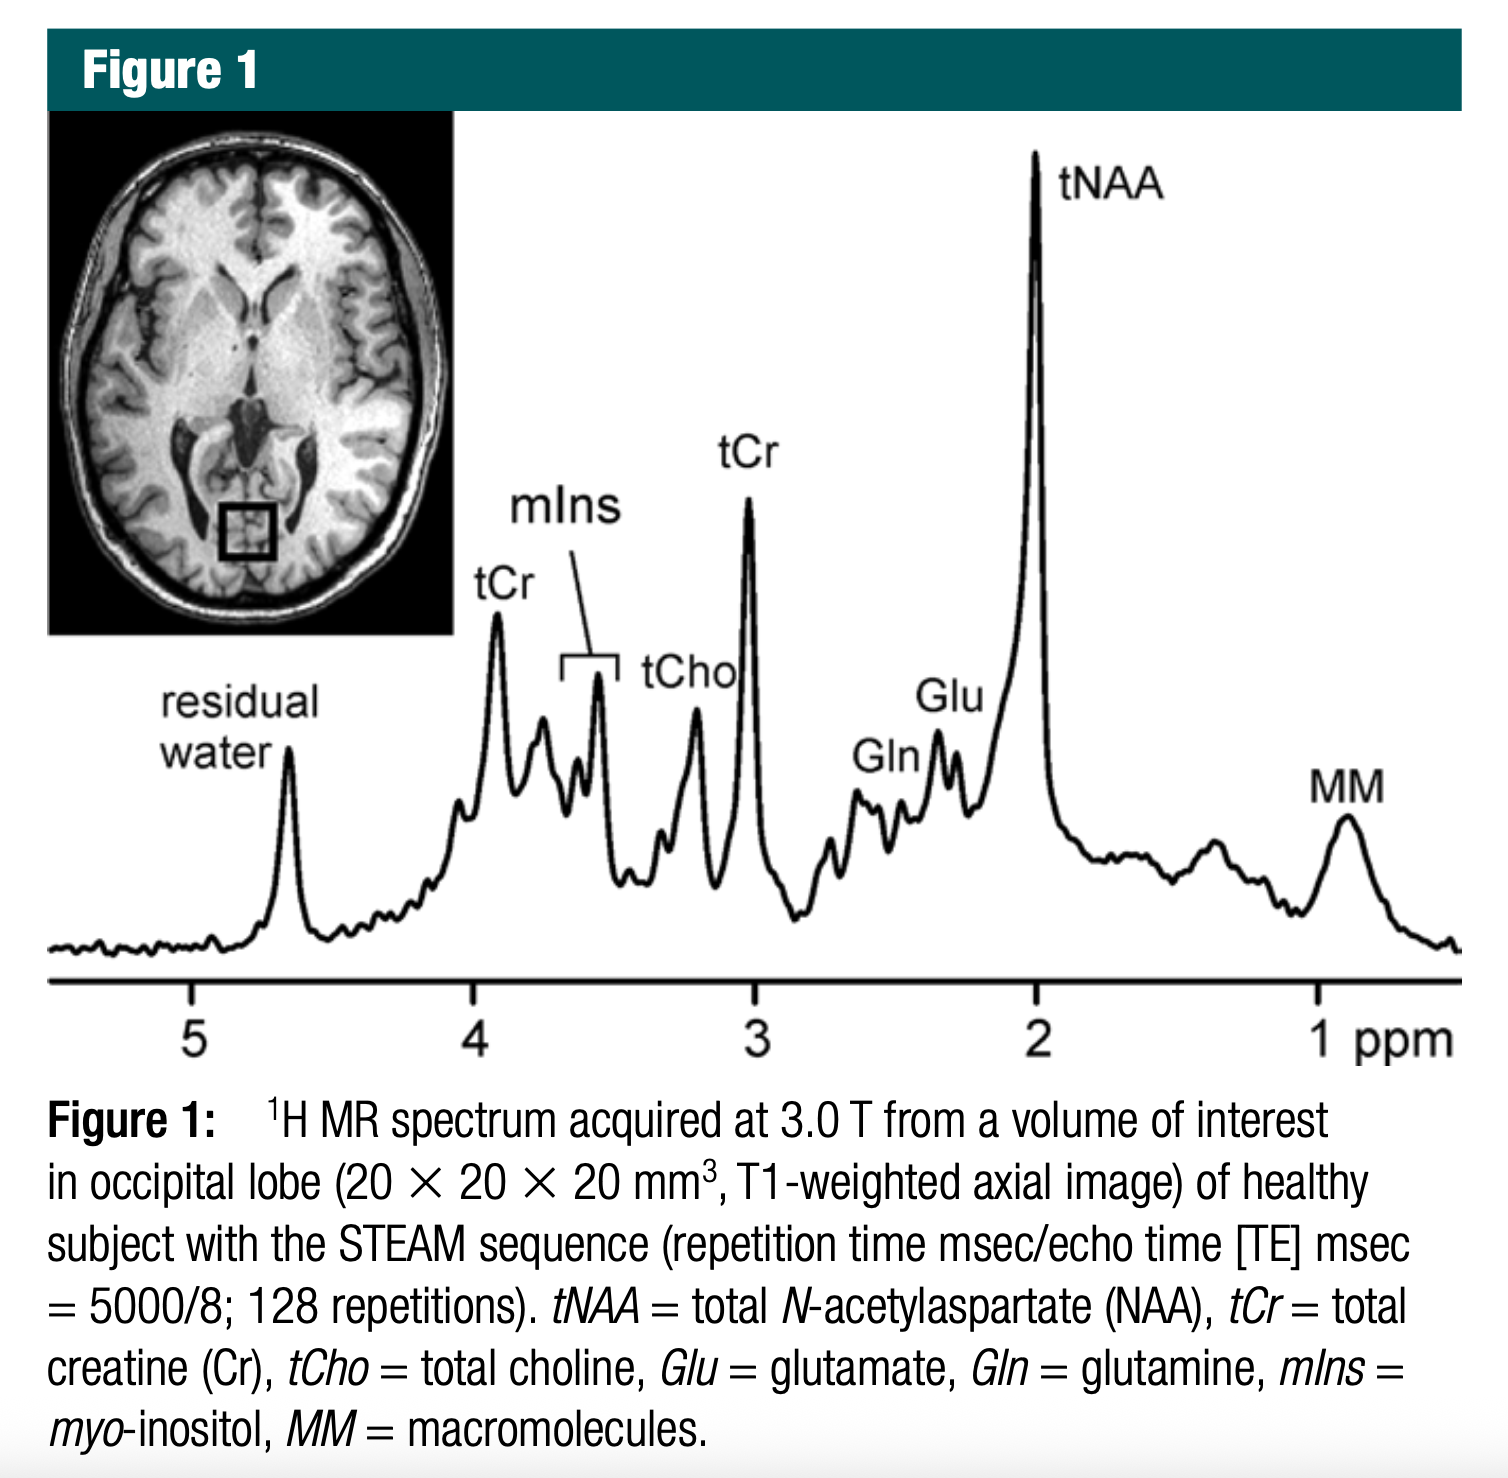
Great! The location of each peak in MR spectroscopy (¹H-MRS) — measured in parts per million (ppm) — is determined by the chemical shift, which reflects the magnetic environment of hydrogen nuclei (¹H) in a given metabolite. This environment is influenced by nearby electron density and functional groups.
Below is an explanation of why each peak is located at a particular frequency in the MRS spectrum you provided:
6.1.1 🧠 Interpretation of Each Peak and Its Location
| Peak Label | Chemical Shift (ppm) | Compound | Why at this location? |
|---|---|---|---|
| Residual water | ~4.7 | H₂O | Water protons are highly deshielded due to strong electronegativity of oxygen and hydrogen bonding. |
| mIns | ~3.5 – 3.6 | Myo-inositol | Inositol’s protons are attached to carbons bearing hydroxyl groups (–OH), causing slight deshielding. |
| tCr | ~3.0 and ~3.9 | Creatine | Methyl and methylene groups in creatine resonate at ~3.0 (CH₃) and ~3.9 ppm (CH₂ next to nitrogen). |
| tCho | ~3.2 | Choline-containing compounds | Trimethylamine group (N⁺(CH₃)₃) is deshielded due to positive charge near nitrogen. |
| tNAA | ~2.0 | N-acetylaspartate | CH₃ group attached to carbonyl in NAA is moderately shielded, thus appears at ~2.0 ppm. |
| Glu, Gln | ~2.1–2.5 | Glutamate, Glutamine | Alpha and beta protons in these amino acids are in complex magnetic environments with multiple electron-withdrawing groups. |
| MM (macromolecules) | ~0.9 – 1.5 | Mobile macromolecules | Broad peaks arise from proteins/lipids in slow motion, with methyl and methylene protons in hydrophobic environments (shielded). |
6.1.2 📌 Why ppm Values Matter
Chemical shift (ppm) is relative and standardized, making MRS comparable across scanners and settings.
Shielding vs Deshielding:
- Deshielded protons (near electronegative atoms or in polar environments) → resonate downfield (higher ppm).
- Shielded protons (in hydrophobic or electron-rich environments) → resonate upfield (lower ppm).
Let me know if you’d like this as an annotated spectrum or simplified diagram.
6.2 MRS Metabolits -> Disease
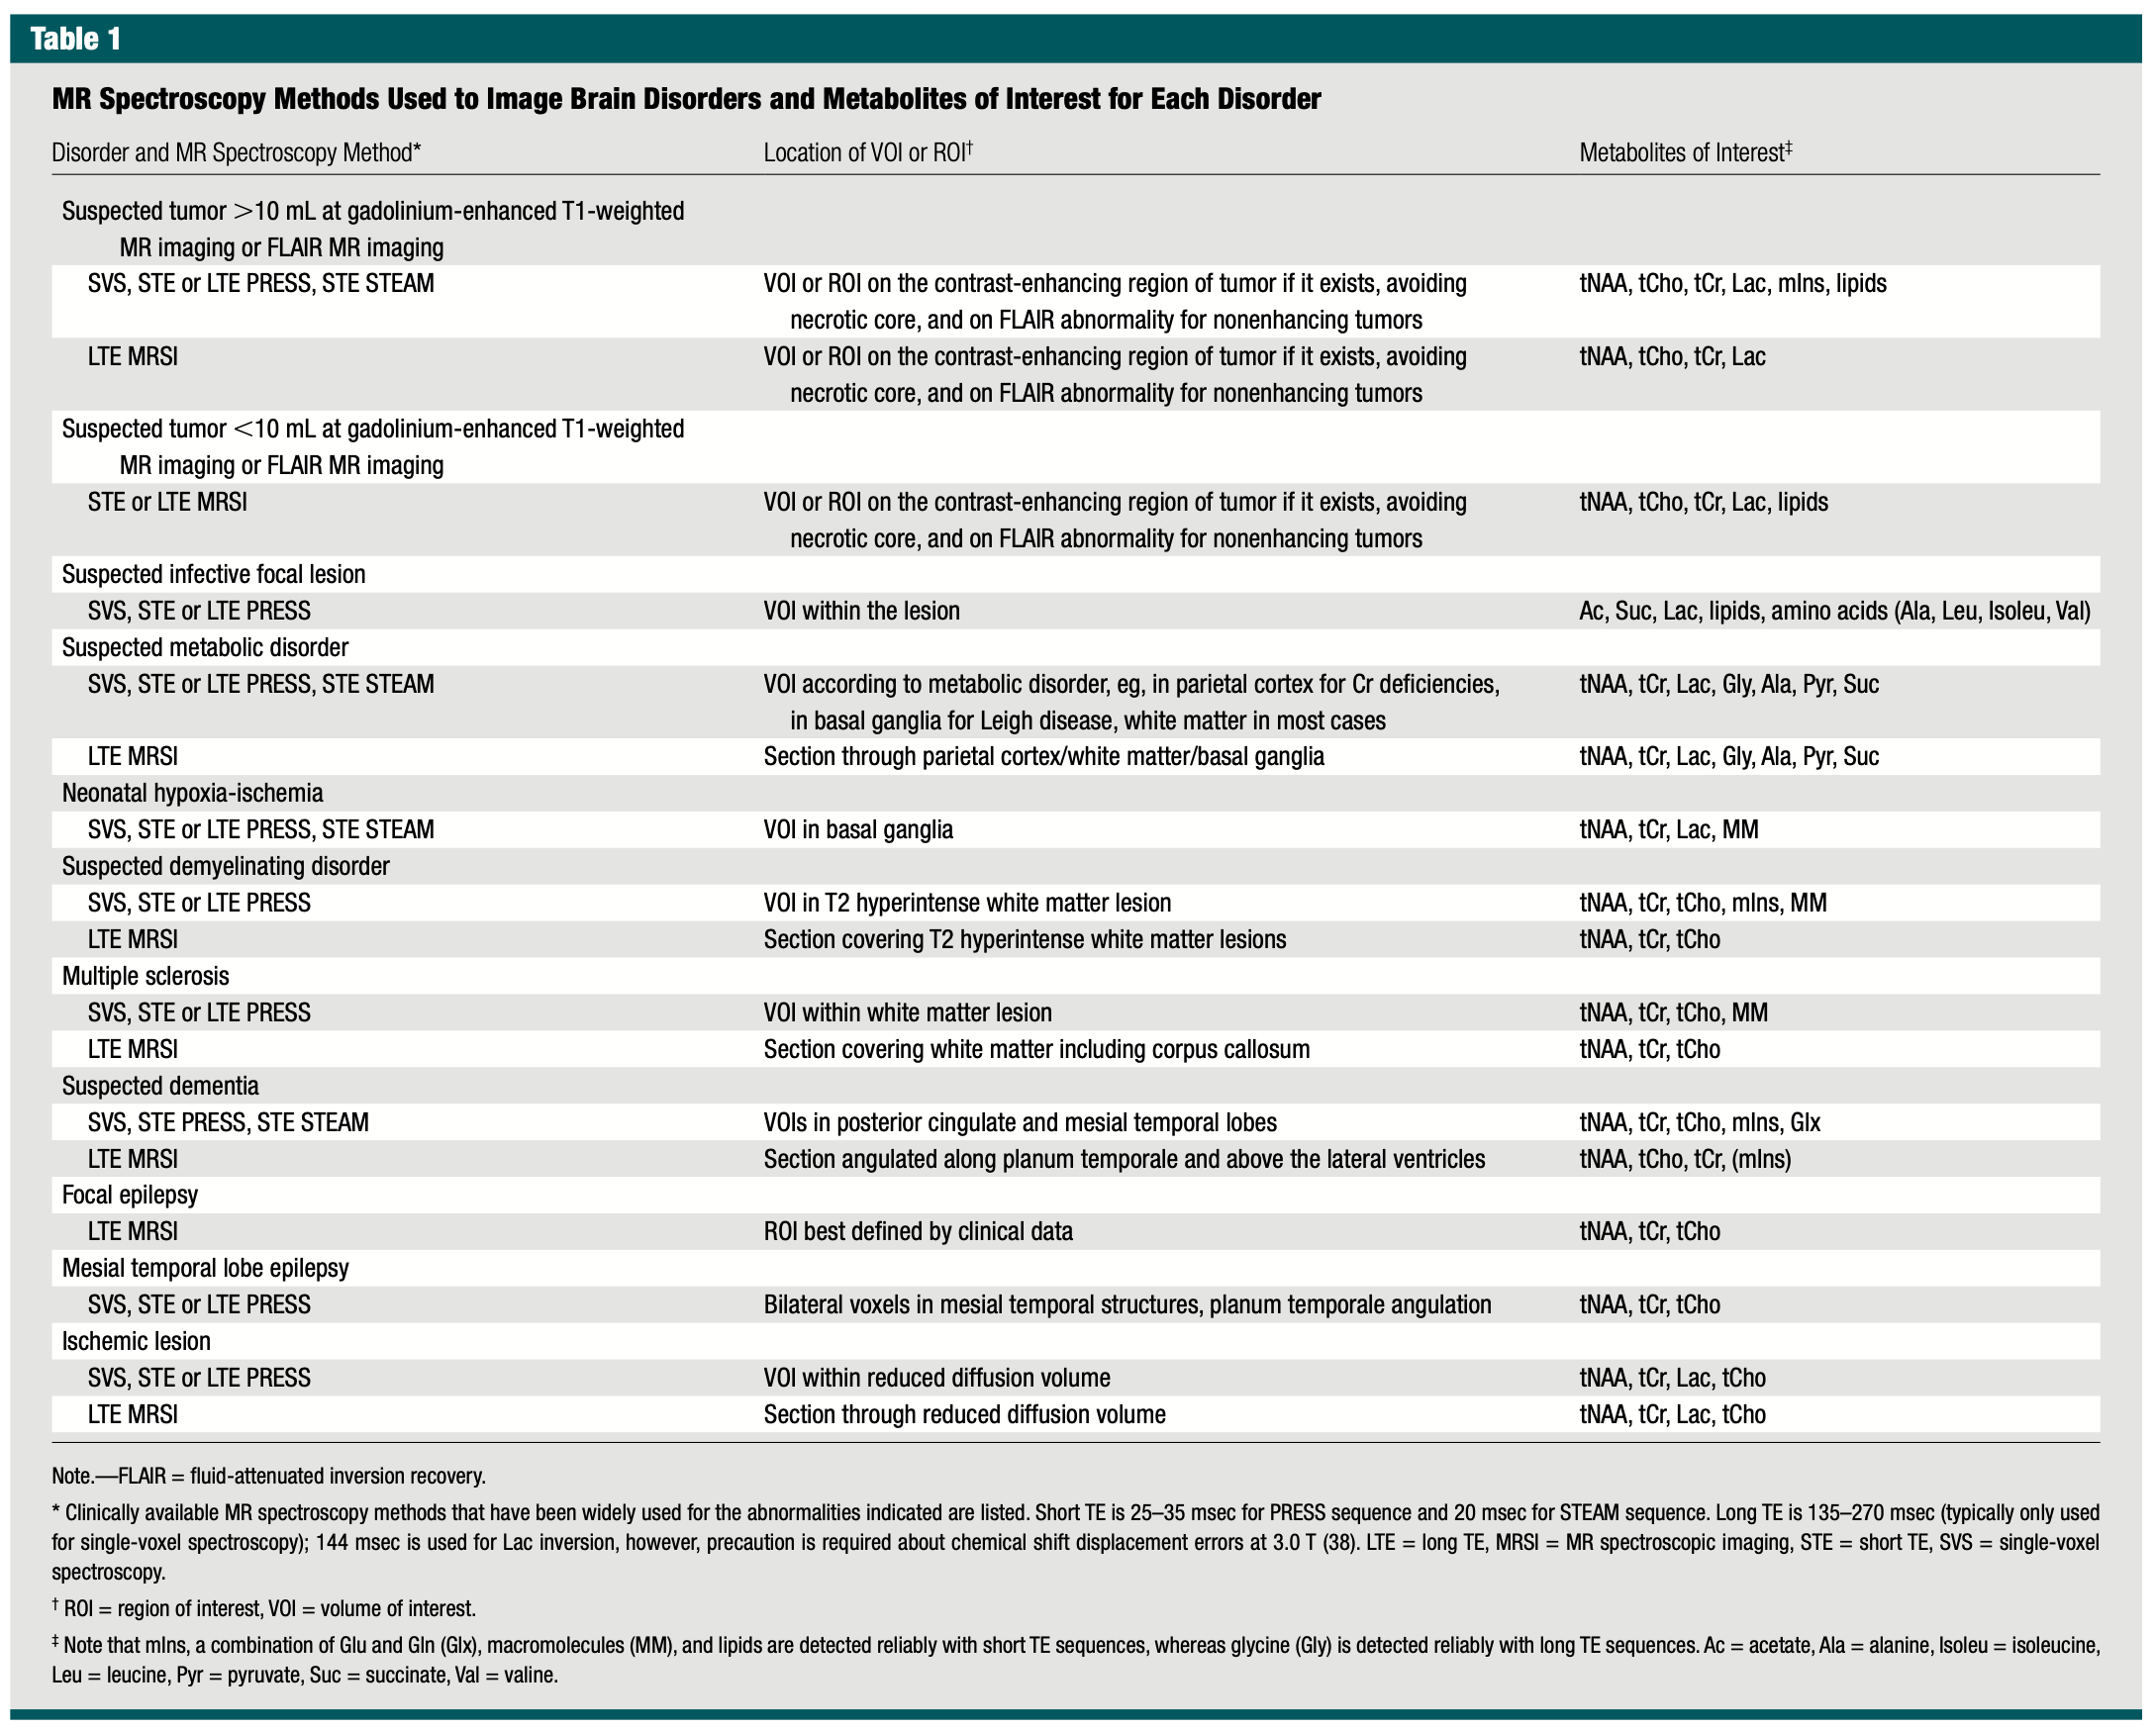
6.2.1 Key ¹H‑MRS Metabolites → Brain Disorders & Pathophysiologic Rationale
| Metabolite (peak) | Typical Spectral Change | Major Disorders in Table | Why it matters (biologic rationale) |
|---|---|---|---|
| tNAA (~2.0 ppm) | ↓ (loss/immaturity) | • High‑ & low‑volume tumors • Metabolic disorders (e.g., Leigh) • Neonatal HIE • Demyelinating disease & MS • Dementias (AD) • Epilepsy (focal & MTLE) • Ischemic stroke |
Neuronal/axonal marker; falls with neuronal loss, dysfunction, or delayed maturation. |
| tCho (~3.2 ppm) | ↑ (turn‑over) | • Tumors (all sizes) • Demyelination/MS • Dementia • Epilepsy • Ischemic stroke |
Choline‑bearing phospholipids rise when cell‑membrane synthesis or breakdown accelerates—tumor proliferation, active demyelination, gliosis, or membrane repair. |
| tCr (~3.0 ppm) | Variable (↓ or reference) | Same spectrum as NAA/Cho (used across almost every disorder in the table) | Energy buffer (phosphocreatine); often used as internal denominator but may fall when ATP synthesis is impaired (ischemia, metabolic disease) or when neuronal density drops. |
| Lactate (~1.3 ppm; doublet) | ↑/appears | • Tumors (necrotic cores) • Abscess/infection • Metabolic disease (mitochondrial) • Neonatal HIE • Ischemic stroke |
End‑product of anaerobic glycolysis; accumulates with hypoxia, necrosis, or mitochondrial blockade. |
| Lipids (0.9–1.3 ppm; broad) | ↑/appears | • Tumors (high‑grade/necrotic) • Abscess/infection |
Mobile fatty‑acyl chains from membrane breakdown signal cellular necrosis or cytoplasmic lipid droplets. |
| Macromolecules (MM, 0.9–1.5 ppm; broad) | ↑ when short‑TE | • Neonatal HIE • Demyelinating lesions |
Short‑T₂ background from proteins/peptides rises with tissue immaturity (neonate) or extensive demyelination. |
| mIns (~3.5 ppm) | ↑ | • Tumors (especially low‑grade) • Demyelination/MS • Dementia |
Glial osmolyte & astrocytic marker; increases with gliosis or astrocyte proliferation. |
| Alanine (~1.48 ppm, inverted at long TE) | ↑/appears | • Infective lesions (bacterial abscess) • Some metabolic disorders |
Product of anaerobic bacterial metabolism; also accumulates in certain amino‑acidopathies. |
| Succinate (~2.4 ppm) | ↑/appears | • Abscess • Metabolic (Krebs‑cycle disorders) |
Anaerobic bacterial metabolite or buildup from impaired oxidative phosphorylation. |
| Acetate (~1.92 ppm) | ↑/appears | • Abscess • Metabolic disorders |
Another bacterial/anaerobic metabolite; also accumulates with defective acetyl‑CoA pathways. |
| Glycine (~3.55 ppm) | ↑ | • Metabolic disorders (e.g., non‑ketotic hyperglycinemia) | Builds up when glycine cleavage pathway is deficient; detectable at long TE. |
| Pyruvate (~2.36 ppm) | ↑ | • Inborn errors of metabolism (PDH deficiency) | Substrate upstream of lactate; accumulates when pyruvate dehydrogenase or mitochondrial entry is blocked. |
| Branched‑chain amino acids (Leu, Ileu, Val ~0.9 ppm) | ↑ | • Abscess | Released by bacterial proteolysis; characteristic “amino‑acid peak” in pyogenic brain abscesses. |
| Glu / Gln (2.1‑2.5 ppm) | ↑/⇅ | • Dementia (early ↑ Glx) • Hepatic encephalopathy (not in table) |
Excitatory neurotransmitter pool; rises when ammonia detoxifies to glutamine or with glial stress. |
6.2.1.1 How to interpret the mapping
Peak direction & magnitude
- ↑ = appearance or elevation; ↓ = relative reduction.
Why multiple disorders share a metabolite
- Many pathologies converge on the same biochemical pathways—e.g., lactate for any anaerobic state, choline for membrane turnover, NAA for neuronal health—so pattern recognition (ratios, co‑peaks, voxel placement, TE) is essential.
Clinical application
- By targeting the voxel to the lesion type outlined in the table (e.g., ring‑enhancing rim, posterior cingulate cortex), radiologists maximize sensitivity for the metabolite constellation most informative for that disease process.